Write a report for a university lecturer describing the information in the graph.
Write a report for a university lecturer describing the information in the graph.
Sample Answer of Write a Report for a University Lecturer Describing the Information in the Graph.
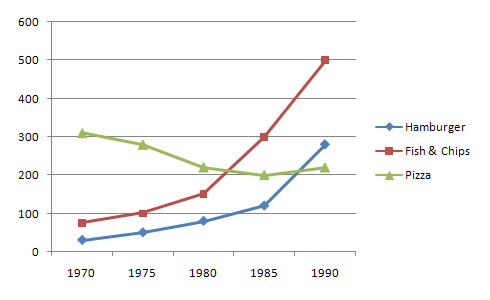
The graph report by university lecturer illustrates the Consumption details of fast food such as hamburgers, fish & chips and pizza in the UK from the year 1970 to 1990.
The population of the UK, in 1970 least likely to have hamburger nearly 30 only and till 1985 there was only minimal increment but after that, there was a rapid increase in that in reached to nearly 300. Similarly, consumption of Fish & Chips at the beginning of 1970 was slightly higher than hamburgers nearly 80 and till 1980 it had slow raised but after that, it took a rocket increment and touch to 500 by the end of 1990.
However, in the year 1970, UK people more prefer to eat pizza nearly 300 which is much higher than other but after that, it starts to decline continuously till 1985 and after that, there was slightly increase till 1990.
Overall, later in the year 1990, people loved to prefer more hamburgers and least like pizza, but in 1980 people loved to fish and chips and pizza equally and after 6-7 years they loved both pizza and hamburgers in same proportionate.
Also Check
Write a letter to the Information Officer at the TAPE Information Office
Fossil fuel, such as coal, oil, and natural gas – Writing Task 2


Leave a Reply