")
The graphs below show the numbers of male and female workers in 1975 and 1995 in several employment sectors of the Republic of Freedonia. Write a report for a university teacher describing the information shown.
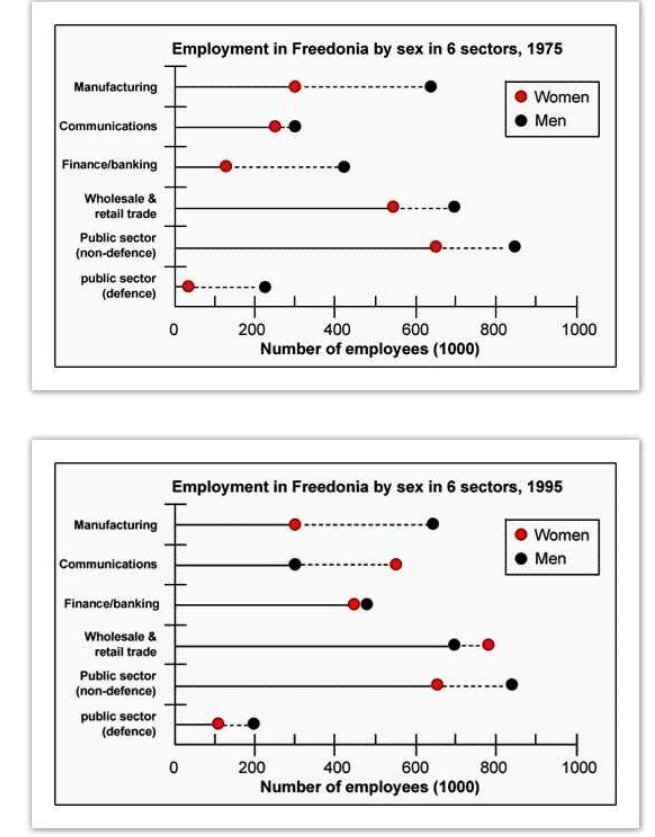
The two bar graphs illustrate the changes in the number of men and women employees in six different sectors in Freedonia in 1975 and 1995.
Overall, the male workers are hired more in all six fields in 1975. however, the female overtake the higher number of jobs in communication sector and wholesale and retail trade in 1995.
In 1975 and 1995, The number of male workers remained the same, the sector of manufacturing(625000), communications(300000), Wholesale and retail trade(700000) and public sector(nondefense)of around 850000. The men employee was increased in the finance sector from almost 425000 people in 1975 to almost 500000 people in1995. on contrast, and there was a small decrease in public sector difference from 225000 to 200000.
There was no change in the female workers in manufacturing(300000) and the public sector of about 65000. There was a high jump in the number of women employees in communications from 275000 to 500000 between 1975 and 1995. Similarly, the banking sector also observed a rise in women workers from 125000 in 1975 and 450000 in 1995. In the public sector, defence and wholesale and retail trade, There was a slight increase in numbers.
Follow Us on Facebook
Also, Read The Bar Chart Shows the Number of Visitors to Four London Museums