
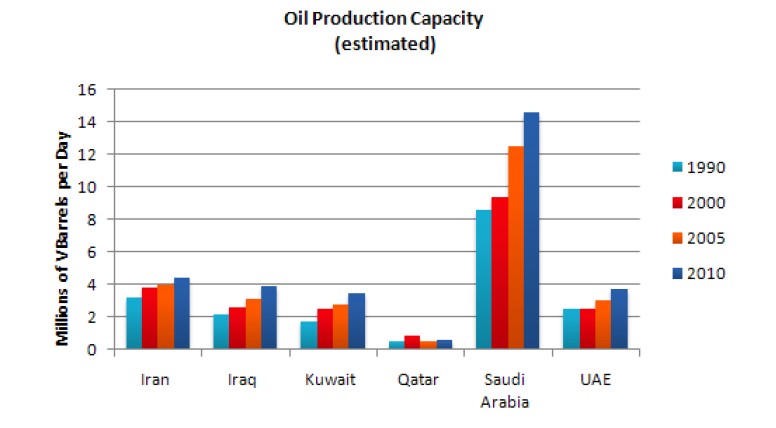
The graph shows the estimated oil production capacity for several Gulf countries between 1990 and 2010. Summarise the information by selecting and reporting the main features, and make comparisons where relevant.
The bar graph gives information about the per day earning capacity from petroleum products in Gulf countries between two decads.
It shows that earning costs from oil production capacity is increase with the time period. In general, it gives that the time passes, the automobile usage rate increases. The most top of the list is Sudia Arabia which is more leading one and the least one in Qatar. With the passage of time, the rate evaluates, but the ratio is different in all gulf countries.
In Saudi Arabia, the rate of oil production capacity increases dramatically with different years. In 2000 they earned about 8.5 million per day which slightly increased in ten years is 9millions. In 2005 its increment was about 3% that rose significantly at the same rate after five years about above 14 million per day. However, it is the great rose in price in oil production capacity.
Iran, Iraq, Kuwait and UAE have the minimum ratio of increasing price at the same rate. There increment very slow but increase gradually. But in these countries, the higher value of income of Iraq is near above 4 million per day. In general, in Qatar, per day income increases with the time period of two decades with very slow in 1990 its value near about 0.5 million which increased to 1 million after passing one decade. In 2005 its earning fall to about 0.5 again and in 2010 it is about 0.7 million per day.
Overall, all countries earnings increase with time, some having greater change some having larger change with time. But, Saudia Arabia has maximum oil production capacity.
Follow Us on Facebook