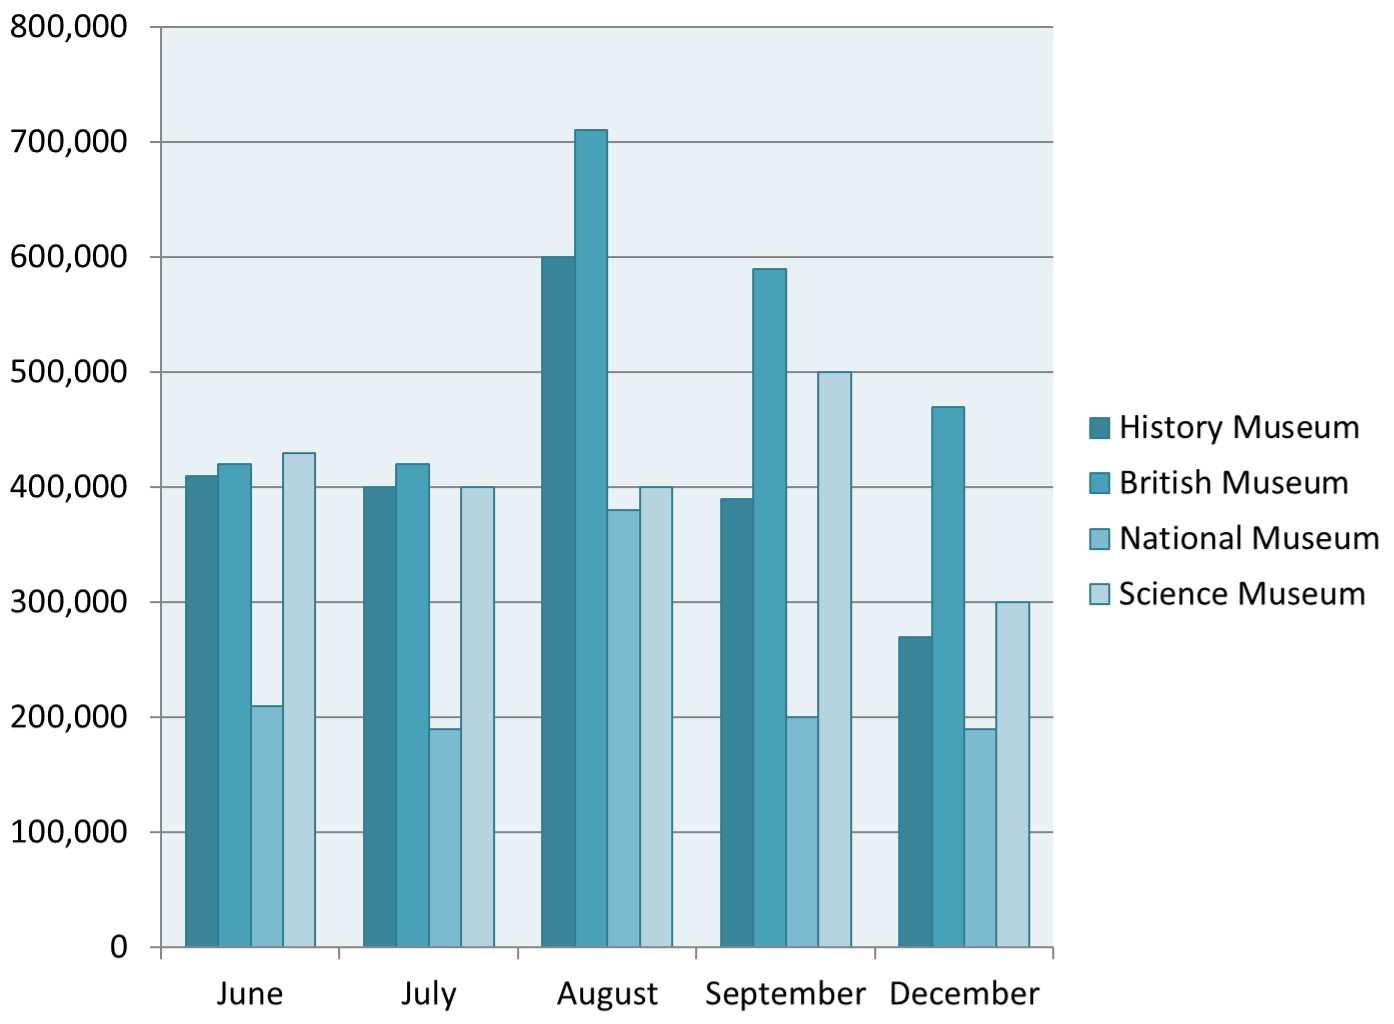
The bar chart shows the number of visitors to four London museums. Summarize the information by selecting and reporting the main features and make comparisons where relevant. Write at least 150 words.
Sample Answer of The Bar Chart Shows the Number of Visitors to Four London Museums
The yielded bar charts demonstrate the number of people who visited four London museums: the history museum, the British Museum, the national museum, and the science museum from June to December. Overall, in the given period, British museum visitors were higher than others whereas national museums were on the least.
For science museum, 410000 citizens visited there in June and in July number was 400000 which remained same for next month. However, 500000 sightseers came in September and number dropped 200000 in December. For history museum, holidaymakers number was 405000 in June and July which jump up to 600000 in August, after one month it declined to below 400000 and continued to downward, finished with 260000 in last month of the year.
The British Museum had the same sightseer number in June and July on account of 407000, and it grew rapidly in August it had more 300000 visitors than the previous month. Later it decreased nearly 100000 per month. For the national museum, 200000 people visited there in June and in July 10000 less citizen seen. After a month, the same as two months ago had and in December same as had in July.
Follow Us on Facebook
Also, Read The graphs below show the different reasons for two groups of students.


