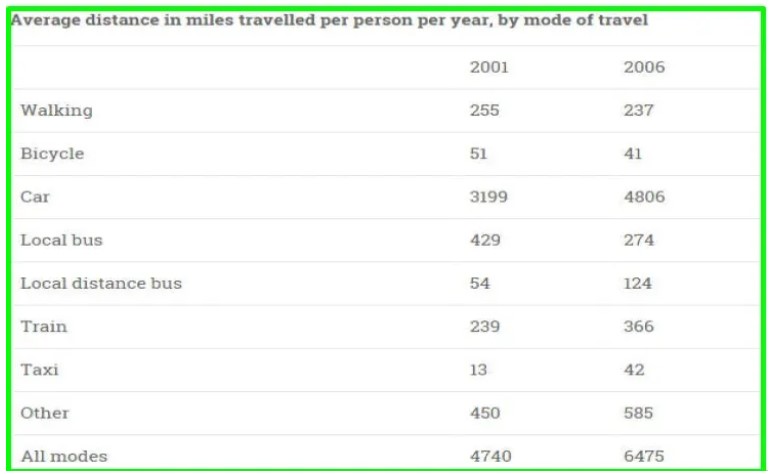
Describe the information in the table and make comparisons where appropriate. Summarise the information by selecting and reporting the main features, and make comparisons where relevant. Write at least 150 words.
Sample Answer of Describe the Information in The Table and Make Comparisons Where Appropriate
The given table compares the total distance travelled by every person in eight different modes of travel in the years 2001 and 2006.
Overall, it can be seen that majority of the people prefer to travel in a car. However, the minority of individuals prefer to travel in other modes of transportation over a five-year period.
In 2001, the distance travelled by people in a car was 3199 miles, which increased sharply to 4806 miles in 2006, a rise of around 1600 miles. Although, individuals covered in a local bus is 429 miles which decreased drastically to 274 miles, whereas the distance covered in a train is 239 miles which rose significantly to 366 miles in the second year. Similarly, the second most preferred transportation is other that accounted at 450 miles, which show a significant rise to 585 miles. Another way of covering the distance is through walking; it accounted for 255 miles. It shows a slight fall to 237 miles.
Follow Us on Facebook


