")
The pie graphs show the nutritional consistency of the two dinners. Write a report to a university lecturer describing the data. Write at least 150 words.
Sample Answer of The Pie Graphs Show the Nutritional Consistency of The Two Dinners
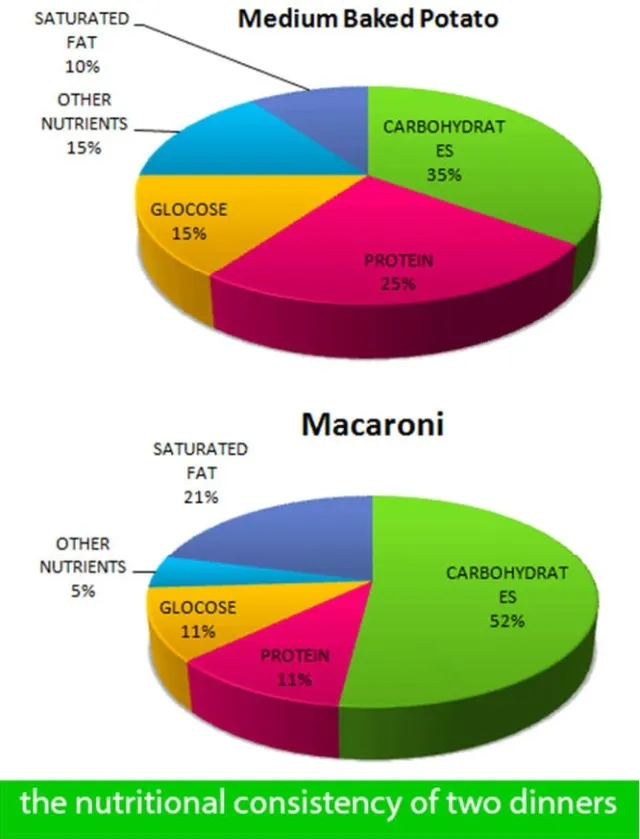
The given pie charts demonstrate two different dinners, medium baked potato and macaroni nutritional consistency.
Overall, the majority of nutrition consistency is a carbohydrate, while glucose and other nutrients are on the least in both dishes.
For medium baked potato dinner, 35% nutrition came from carbohydrates which are a bigger percentage than others, and the protein proportion is a tenth percentage less than carbohydrates. Other nutrients and glucose consist of the same amount of nutritional on account of 15%. The lowest nutritional in this dinner is saturated fat, and it has only a 10% proportion.
For macaroni dinner, a half proportion of nutritional come from carbohydrates; however, other nutrients has only 5% of consistency which is the lowest for this dinner. 11% is for protein and glucose, while almost double the amount of nutritional consistency is saturated fat (21%).
Follow Us on Facebook