The graph below shows the number of inquiries received by the Tourist Information Office
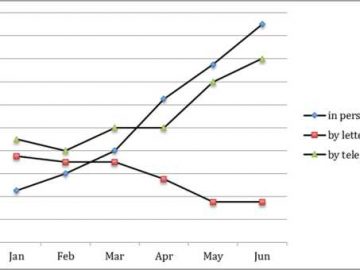
The graph below shows the number of inquiries received by the Tourist Information Office in one city over a six-month period in 2011 You should Read More
The graph below shows the number of inquiries received by the Tourist Information Office in one city over a six-month period in 2011 You should Read More
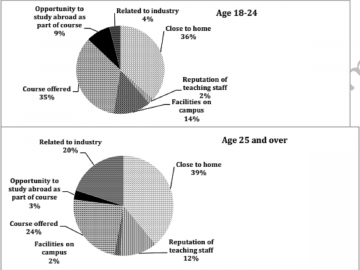
Sample answer 1:- The given pie charts illustrate the information about the different reasons for two groups of learners to choose Dorrifod university. It Read More
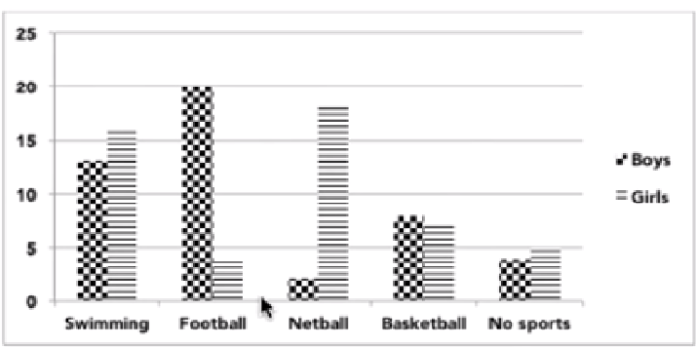
Sample answer 1:- The given bar graph illustrates information about the proportion of Australian children in sports outside school hours in 2014. It can be Read More