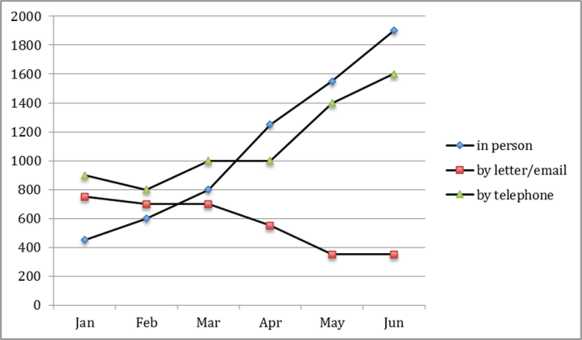
The graph below shows the number of inquiries received by the Tourist Information Office in one city over a six-month period in 2011
You should write at least 150 words.
Summarize the information by selecting and reporting the main features and make comparisons where relevant.
sample answer 1 :
The line graph represents the information about the number of queries collected by the tourist information office in six months in 2011
It can be clearly seen that count of queries received through letter follows the little bit variations between January to march. Moreover, in January the sum of queries received through telephone was almost doubled as compared to queries received in person. besides this, queries received through telephone reached 1000 in march and remain the same till April. While the number of requests in person increased to 800.
Moving further, it is evident from the graph that in April queries received through emails recorded as half of the queries received in person that was 600 and in may it decreased to around 400 and followed the same trend up to the month of June. While in may sum of queries received through telephone and in-person was around 1400 and 1600 respectively. As well as in June personally collected requests reached their peak point that was approximately 1900 and queries received by telephone increased by 200 which was 1400.
It can be concluded that the number of requests in person showed a steady but significant rise over the period while the sum of queries by letter experienced a downward trend.
sample answer 2:
The given line graph illustrates the queries received by the tourist information office in one city between the months of January to June.
A small number of personal inquiries were made in the first two months. (300), but this number increased significantly and reached 1300 by April. Then, there was a steady increase, and by July these increased markedly and reached 1900.
In the initial months, online and letter inquiries were much popular (800), but by the end of the fifth month, they plummeted to 360. These types of inquiries showed a constant pattern of decline over the six-month period.
Interestingly, telephone inquiries showed a lot of fluctuations. It accounted for a huge 900 in January, however, is reduced to 800 in the next month followed by remaining a constant of 1000 in March and April which suddenly boosted to 1600 by the end of June
Overall, there was an upward trend in the case of telephone and personal inquiries, whereas letter and email queries took a back seat along the course of time.
This is the end of academic writing task 1 (The graph below shows the number of inquiries received by the Tourist Information Office in one city in 2011.)
Follow us for More Updates on Twitter