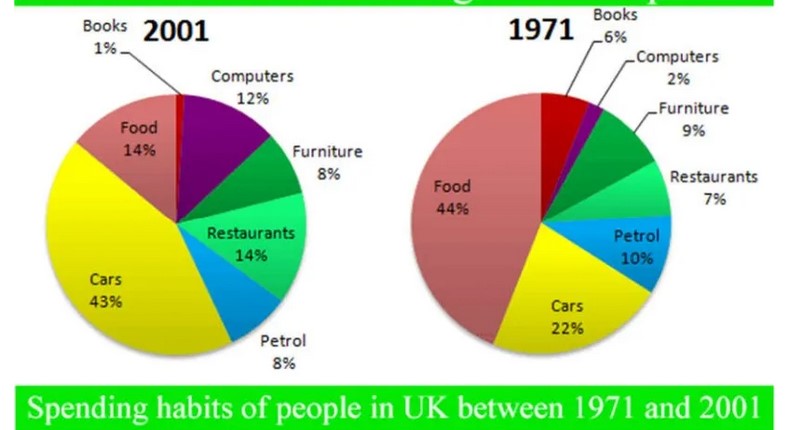
The graphs show changes in the spending habits of people in the UK between 1971 and 2001. Write a report to a university lecturer describing the data. Write at least 150 words
Sample Answer of The Graphs Show Changes in the Spending Habits of People in the Uk Between 1971 and 2001
The pie charts depict the variations in the proportion of utilising habits of United Kingdom citizens in 1971 and 2002.
It is lucid that in 1971 around 44 % people gave priority to food habit whereas, after 32 years the proportion of food decreased steadily which was around 14 %. More preference was given by citizens in the UK to cars habits in 2002 than the other year. The percentage was 43 and 22.
In contrast, in the restaurant and computer factors, more people were interested in later years as compared the initial year which was around 14% and 12%. However, around 8 % spending furniture habit of individuals in the first year although the percentile was led with 1 in 2002.
Overall, The proportion of the food habit of British people was the highest in the initial year whereas it was three times least in the later year.
Follow Us on Facebook


