 (1)")
The pie chart shows the amount of money that a children’s charity located in the USA spent and received in one year, 2016. Summarize the information by selecting and reporting the main features and make comparisons where relevant.
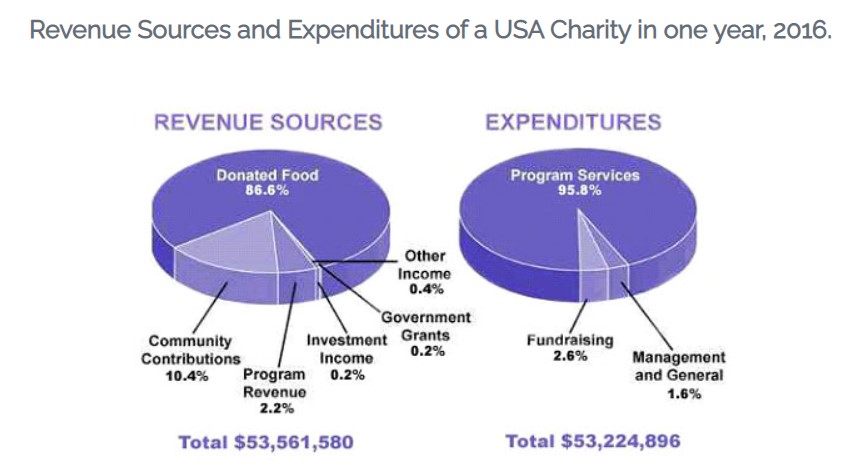
The pie charts illustrate information about revenue sources and expenditures in terms of money for one charitable trust of children’s development available in America for one particular year of 2016. The data was measured in percentages (%).
It is conspicuous from provided charts that children’s charity gained a total of $53,561,580 from the different sources of income; on the other hand, charity’s expenditures were $ 53,224,896 in the year 2016. It is readily apparent that a major source of revenue is from donated food. At the same time, child charitable trusts spend more money on myriad program services for a given year.
Explicitly, from the donated food, charity obtained the highest source of income which is over the third quarter (86.6%). Community contributions are the second source of revenue which is 10.4%; however, it is eight-time lesser than donated food at the opposite side five-time inclined than the revenue generated by the program to the charity. Furthermore, investment government and other incomes provided their contributions to the charity to plunge to a level which is in between 0.4 to 0.2%.
On further scrutiny, charity’s main expenditure is program services which are 95.8%. Moreover, fundraising and general management have only a 1% difference which is 2.6% and 1.6%, respectively.
Follow Us on Facebook
Also, Read The Table Beneath Shows The Level of People Specialists in Various Kinds