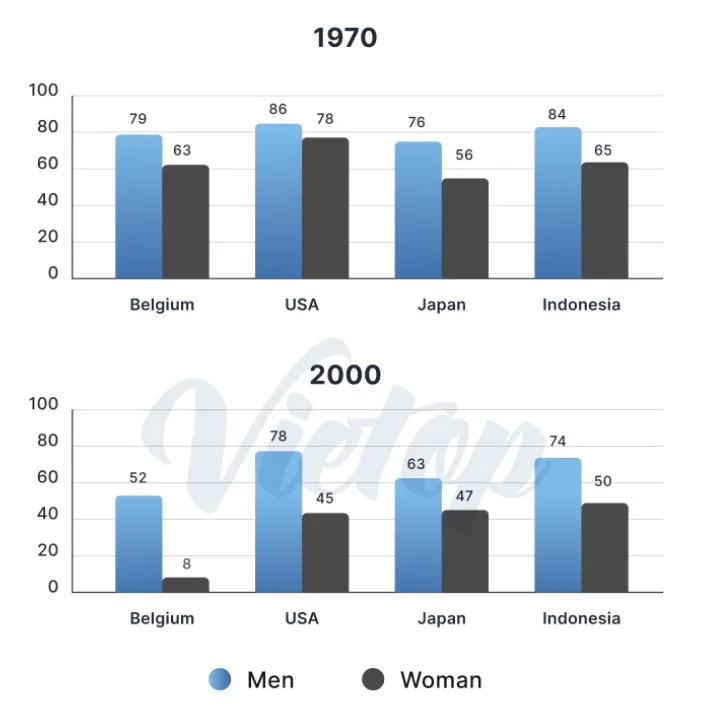
The Chart Show information about the percentage of men and women aged 60-64 who were employed in four countries in 1970 and 2000. Summarize the information by selecting and reporting the main features, and make comparisons where relevant.
 Sample Answer of The Chart Show Information About the Percentage of Men and Women Aged 60-64
The two bar graphs illustrate the information about the proportion of employed males and females aged 60-64 in Belgium, the USA, Japan and Indonesia in 1970 and 2000.
Overall, it can be clearly seen that in both years in 1970 and 2000, more males were employed than females.
In 1970, the USA had the highest employment rate with 86% males and 78% females doing jobs. Indonesia came the second highest with 84% and 65% employed men and women respectively. 79% of males were working, and 63% of females were doing jobs in Belgium. Japan had the lowest employee rate, 76% males and just 56% females were working.
Moving further, in 2000, males worked in 78%, 74% and 63% whereas females were 45%, 50% and 47% in USA, Indonesia and Japan respectively. Belgium recorded the lowest percentage were more than half males and just 8% females working in jobs.
Follow Us on Facebook


