
Sample answer 1:-
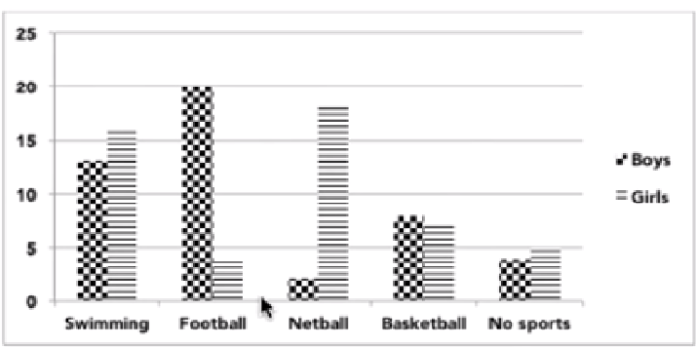
The given bar graph illustrates information about the proportion of Australian children in sports outside school hours in 2014.
It can be clearly seen from the bar chart that the proportion of boys was 2% who played football which was the highest percentage as compared to others. With it, in swimming, the percentage of boys was decreased sharply to 13% than football. After that in the proportion of boys was declined significantly at 3%. The percentile of boys was approximately the same (4% and 8% respectively) in no Sports and basketball sports.
Moving further, in netball, the percentage of girls was 18% which was the greatest proportion as compared to others. Furthermore, the portion of girls went down minimally 15.5% in swimming than others. While, in the football field, the proportion of girls was come down significantly by 4%. Probing further, in no sports and basketball sports, the proportion of girls was closely the same 5% and 6% respectively.
Overall, it is clearly seen that the maximum percentage of boys was in the football field and the minimum proportion of girls was in football sports.
Sample answer 2:-
The given vertical bar graph compares both gender participation in diversion exterior school hours in Australia in the given the year 2014.
To elaborate, association in football game males were outnumbered with females counterparts with 20% and 4% accordingly. With it, women more participation in swimming on 155 as compare to men less than 2%. As well as, boys were less community in netball at 2% but, unfortunately, girls were on 18% in the given time.
Moreover, furthermore relevant that, Males and females fellowship in basketball almost same at 9% and 8% respectively. Boys participation in no sports 4% rather than 5% at girls.
Overall, women were more distribution in different games swimming, netball, no sports in contrast to men.