The Map of a City in 1950 and now. Summarise the information by selecting and reporting the main features, and make comparisons where relevant.
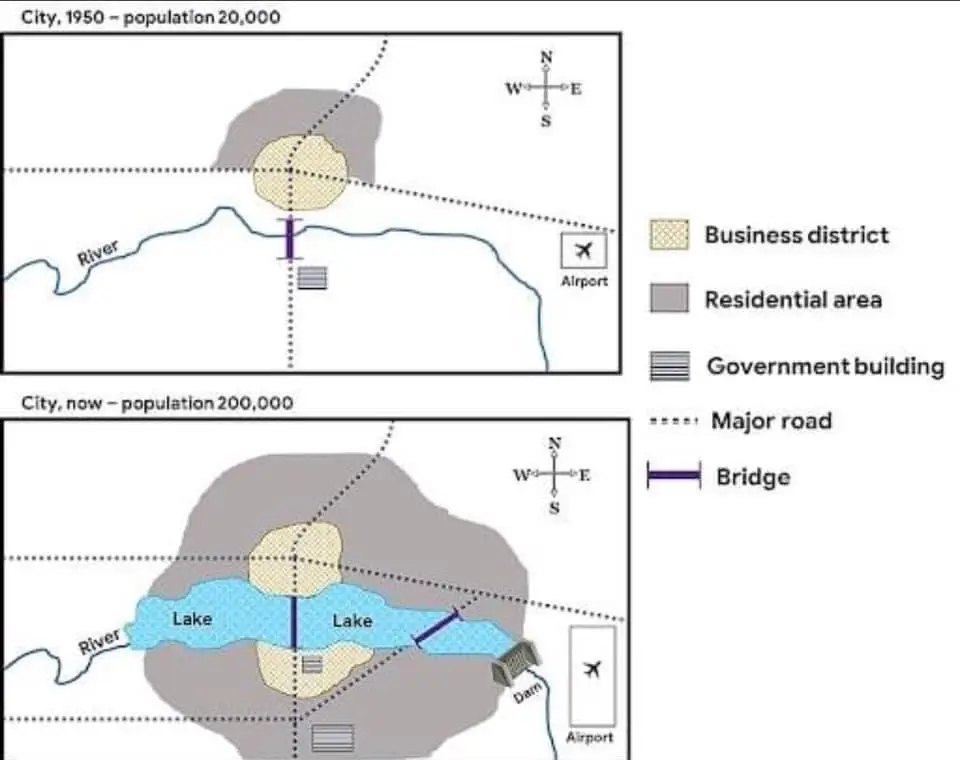
The planning chart of a metropolis shows business district, residential area, government building, bridge and River in 1950 and now.
Overall, it shows that the number of inhabitants in that city as of 1950 was 20,000. Similarly, it has increased sharply to 200,000 now. In 1950, it shows that airport was little and very close to major road, whereas now the airport has increased drastically change and a bit far from the major road. Another main point is the residential area of today is incomparable with 1950 residential area, today residential area is far larger.
It is also shown that River didn’t cross-area of residence, and it has only a bridge, while today it crossed a residential area with two bridges with the lake on both sides. The government building was very small, close to the residents in 1950, but increased in number and size. The business district in 1950 dropped dramatically while increases now to the extent it passes River and lake. Finally, the road network in the olden days was poor but very much in increase.
Follow Us on Facebook