The charts below show the figure for work hours per week in the industrial sector in four European countries in 2002. Summarize the information by selecting and reporting the main characteristics, and compare with the corresponding ones.
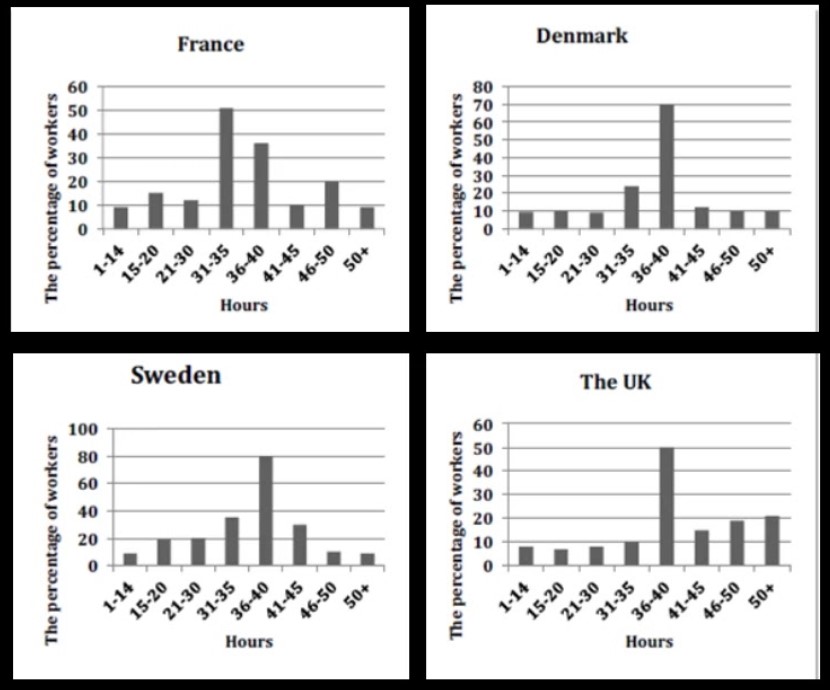
The bar graphs illustrate the number of hours spent on work per week, in industrial sectors in France, Denmark, Sweden, the UK in 2002.
Overall, it is apparent that the maximum workers worked 36-4- hours and least spending time 1-14 hours, but in France, the maximum workers worked 31 to 35 hours per week.
An in-depth analysis of the bar graphs reveals that, in France, approximately, ha;f the workers work for 31 -35 and 36-40 hours, 50% and 38% respectively. Only 20% of workers are worked in 4650 hours. Other working hours are accounted for around 12%, and fewer workers each Denmark, Sweden and the UK witnessed the highest proportion of people working fr 36-40 hours, which was quite different from France. The second and third highest proportion for (31-35 and 41-45)Denmark and Sweden. Comparatively, Sweden’s little increase showed in the number of the hours who spent the time of workers almost 10%.
Furthermore, the percentage of workers time comparatively less in the UK workers hours and 46-50 hours and 50+ hours almost 20% of workers worked. On the other hand, comparatively, other European countries place 46-50 and 50+hours, only less than 10% witnessed by Sweden.
Follow Us on Facebook
Also, Read The Pie Chart Below Shows Where Energy Is Used in a Typical Australian Household