The bar graph below shows the numbers of male and female research students studying six computer science subjects at a US university in 2011. Summarise the information by selecting and report in the main features, and make comparisons where relevant.
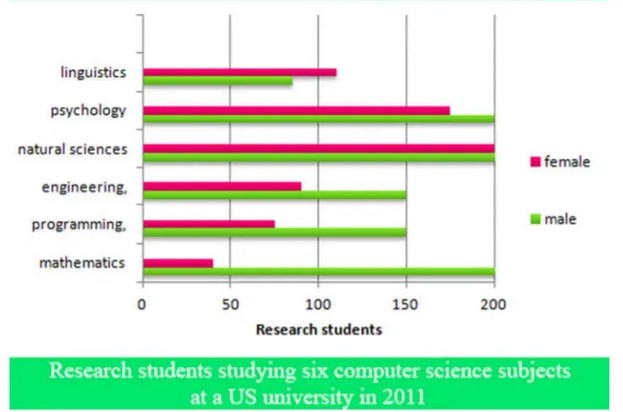
The bar chart illustrates information about the number of pupils who get admission to a computer science course at an American university in the year 2011. Researcher students categorized in total six different subjects and it is mainly compression of a total number of Men & Women which are participated in each subject of the computer department.
Firstly, the most preferred subject choice for the male candidate is psychology, Mathematics and natural sciences in which total of 200 men participated in the computer department, at the other hand natural sciences have the same number and almost 175 number female students chose psychology, and it is quite interesting that women abominate numerical subject such as Maths which clearly shown from the data as only 40 females have taken part in Mathematics.
Secondly, female students delight to study for a language subject than the male candidates as more than 100 Numbers shows interest for same. Total 150 each Fresher man students have a soft sport for engineering and coding subjects instead of that less than 100 Nos. Women candidates like to get to continue in same two subjects.
Overall, from the data, it can conclude that male candidates are higher than the female for almost every subject of computer science at a United States university in the year 2011.
Follow Us on Facebook