The bar chart below gives information about the percentage of the population living in urban areas in different parts of the world. Summarise the information by selecting and reporting the main features, and make comparisons where relevant.
Sample Answer of The Bar Chart Below Gives Information About the Percentage of The Population
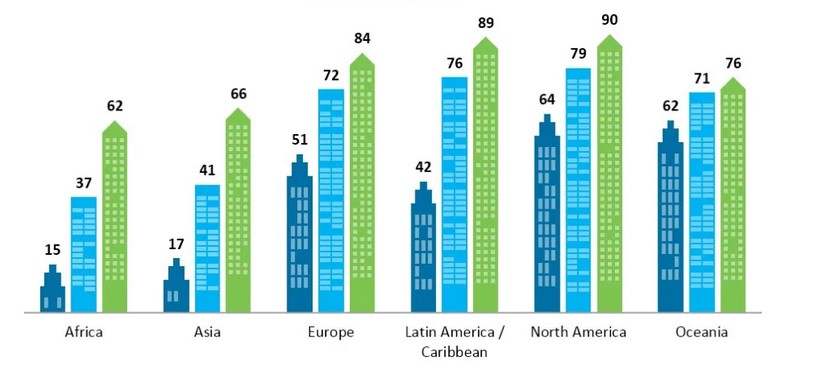
The bar chart depicts the data about the ratio of the citizens residing in cities in various continents of Globe. The years under consideration are 1950, 2007, and 2050.
Overall, it is immediately apparent that, in each of the mentioned cities, the number of people adapting to live in city areas is burgeoning.
To begin with, in Africa, only 15% of the people lived in urban areas; which then grew to 35% in 2007, before levelling off at 62% by the end of the year 2050. Similarly, in Asia, around 17% of people lived in cities in the year 1950; however, it increased rapidly and is expected to reach a top of 66% in the year 2050. In the Caribbean continent, a similar trend is forecasted to be followed; in this, numbers are expected to rise from 42% to 90% by the end of the period.
Moving to the more detailed analysis, there are only a few differences expected in the other three regions. In Europe, in 1950, just above half portion of population lived in the cities; however, which then increased to 72% in 2007, and it would hit a top of 84% by 2050. Besides, in North America, where the majority of the population, around nine in ten, are expected to be shifted towards urban areas, the highest amongst all the continents, by the year 2050. In Oceania, a change of only 15% is expected to be done, from 62% to 76%, in the delineated period.
Follow Us on Facebook
Also, Read Some Believe That People Will Buy a Product Based on Their Needs