The graphs above give information about computer ownership as a percentage of the population between 2002 and 2010, and by the level of education for the years 2002 and 2010.
Sample Answer of The Graphs Above Give Information About Computer Ownership as a Percentage of the Population Between 2002 and 2010
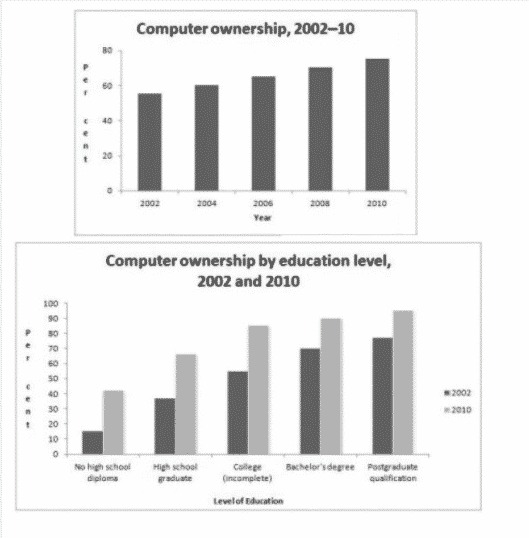
The provided two bar graphs illustrate the comparison analysis of people who owned computers as per the population from 2002 to 2010, and in terms of educational level in 2002 and 2010 respectively.
Overall, the percentage of computer ownership increased gradually and consistently in the given period, in the cases of both the graphs.
Having first looked at the graph makes it clear enough that in 2002, the total percentage of people who owned computers was nearly 60, out of which postgraduates had the highest percentage of approximately 80; however, people with no high school diploma registered the least percentage (in between 10 and 20). In the following years of 2004, 2006, and 2008, the figure reached more than 60% by adopting a pattern of continuous growth.
Further screening the second graph assists in analyzing that from high school graduates to degree holders, the percentage of computer ownership ranges between 40% to 70% in the year of 2002; while, in 2010, the data was recorded relatively higher. Similarly, a rise of almost 10% was noticed in the case of people who had acquired a post-graduate degree, between 2002 and 2010.
Also, Check
Describe An Old Friend You Got in Contact With Again.
Write a letter to your boss apologizing for the recent meeting you missed at work