The chart below gives information about “Istanbul Promo plus” sales in 2007. Summarise the information by selecting and reporting the main features, and make comparisons where relevant. Write at least 150 words.
Sample Answer of The chart below gives information about “Istanbul Promo plus” sales in 2007
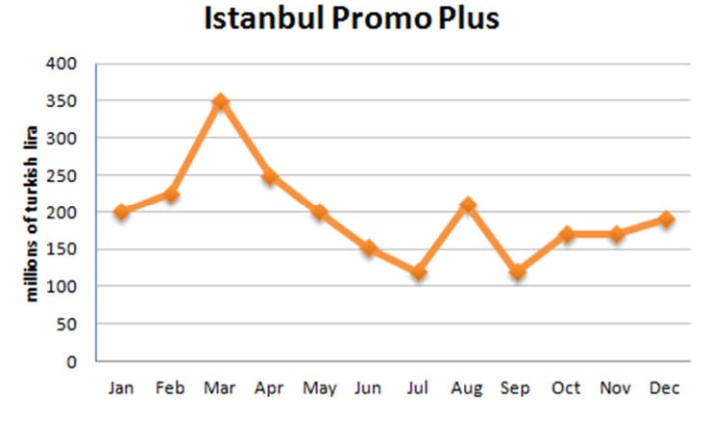
The line graph illustrates the trading of “Istanbul promo plus” in the year 2007. The units are measured in millions of Turkish lira.
Overall, the sales of Istanbul promo plus shows the fluctuations over the period. It manifested a soaring increase in March and August and at least in the months of July and September.
In the months of January and February, there was A slight increase in sales by 200 to around 230. Which was, later on, reached at the peak by 350 in March. It appears to be the highest sales throughout the year. Later on, continuous for four months it shows the plummet decrease in sales by 250, 200, 150, and 100 which was increased to 200 in the month of August and dropped to 100 in September. At the end of the year, there was a steady increase in the sales over in the months of October, November, and December with the figure in between 150 and 200.
Follow Us on Facebook
Also, Read The Chart Below Shows the Places Visited by Different People Living in Canada.